
How Light Intensity Affects Plant Growth and Morphology
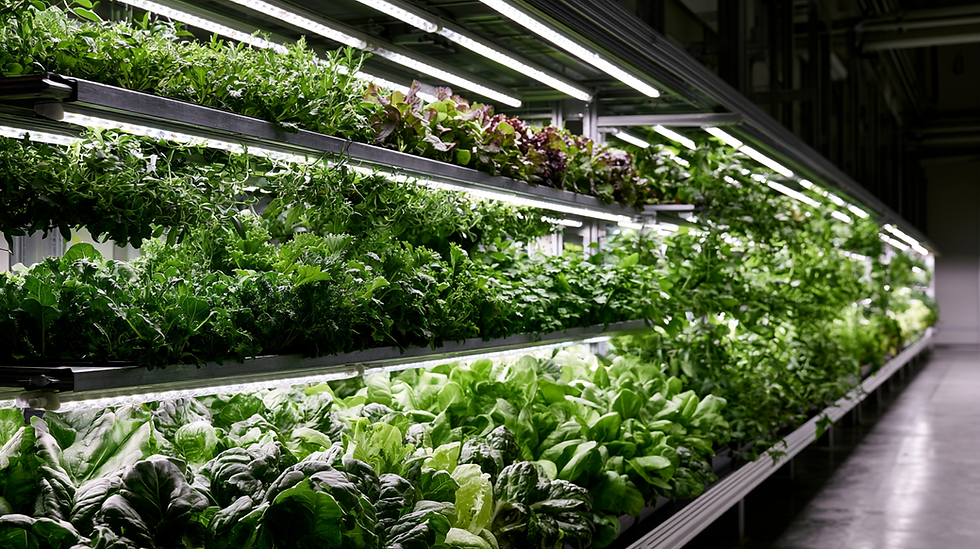
Light is the primary energy input in any plant production system — yet it is also one of the most misunderstood variables when it comes to its quantitative effects. While much of the industry discussion focuses on spectrum (red/blue ratios, far-red supplementation), light intensity ultimately determines how much energy is available for growth — and how that energy is used.
The research shows a more nuanced reality: light intensity does not simply scale photosynthesis linearly. It reshapes plant architecture, alters carbon allocation, and directly influences yield, morphology, and biochemical composition. Understanding these relationships is essential for designing LED lighting systems that deliver consistent, high-quality production — not just photons.
Measuring Light Intensity: PPFD and DLI for plant growth
In horticulture, light intensity is defined through two complementary metrics.
Photosynthetic Photon Flux Density (PPFD) describes the number of photons in the PAR range (400–700 nm) reaching a surface per second, expressed in µmol·m⁻²·s⁻¹. It is a snapshot — a momentary measurement of light at a specific point.
Daily Light Integral (DLI) integrates this intensity over time, expressing the total photon dose received per day in mol·m⁻²·d⁻¹. It combines intensity and photoperiod into a single biologically meaningful value.
This distinction is critical. Two systems operating at identical PPFD can produce entirely different results if the photoperiod differs, because plants respond to total daily photon accumulation rather than instantaneous intensity alone.
Typical crop ranges illustrate this clearly. Leafy greens perform well around 12–17 mol·m⁻²·d⁻¹, herbs often require 18+ mol·m⁻²·d⁻¹, while fruiting crops such as tomatoes demand 20–30 mol·m⁻²·d⁻¹ for optimal yield.
In practice, extending photoperiod at moderate PPFD often produces better results than short bursts of high intensity. This keeps plants within efficient photosynthetic operation for longer periods, avoiding stress responses while increasing total carbon assimilation.
The Photosynthesis intensity curve: from Compensation to Saturation
The relationship between light intensity and photosynthesis follows a predictable physiological curve.
At very low intensity, plants operate below the light compensation point, where respiration exceeds photosynthesis and net growth is negative. As intensity increases, plants enter a linear response zone where photosynthesis, stomatal conductance, and biomass accumulation scale directly with PPFD.
Eventually, the system reaches the light saturation point, beyond which additional photons no longer increase photosynthesis. Excess energy must be dissipated through photoprotective mechanisms.
At even higher intensities, plants enter the photoinhibition zone, where photosystem II is damaged and efficiency declines. In tomato, for example, PPFD above ~500 µmol·m⁻²·s⁻¹ under long photoperiods can induce measurable stress and reduce performance.

The implication for growers is straightforward: optimal lighting design targets the linear response zone, not maximum intensity.
Light Intensity and Yield: nonlinear but predictable
Light intensity is one of the strongest predictors of yield — but only within the usable range of the plant.
Increasing DLI generally leads to:
* Higher biomass accumulation
* Faster crop cycles
* Increased fruit size and number
In greenhouse tomato production, even a 1% reduction in available radiation can reduce yield by 0.6–1.1%, highlighting the direct link between light and productivity.
However, once the crop reaches its saturation point, further increases in light do not translate into proportional yield gains. Instead, they reduce energy-use efficiency — a critical factor in indoor farming economics.
How Light Intensity influences plant growth
Light intensity does not only determine how much a plant grows — it defines how the plant is built.
Low Intensity: Shade Avoidance Morphology
Under insufficient light, plants activate the Shade Avoidance Syndrome (SAS) — a coordinated set of responses driven by photoreceptors.
Plants become taller, with elongated internodes, thinner leaves, and reduced branching. Leaf area increases, but structural density decreases. Carbon is allocated toward light capture rather than biomass accumulation.
This results in plants that may appear larger but are structurally weaker and less productive. Studies show that low-light plants often have lower dry matter, reduced carbohydrate reserves, and lower photosynthetic enzyme activity despite larger leaf area.
High Intensity: Compact, Productive Growth
As light intensity increases toward optimal levels, morphology shifts in a productive direction.
Leaves become thicker, with higher chlorophyll density and more developed palisade tissue. Stem diameter increases, branching improves, and overall plant architecture becomes compact and robust.
Dry matter accumulation increases significantly because photosynthesis exceeds respiratory demand. This strengthens the source–sink relationship, supporting root development and nutrient uptake.
A study on purple-leaf butterhead lettuce ('Teodore') illustrates the scale of these effects: shoot fresh mass increased by 275% in seedlings grown at 600 µmol m⁻² s⁻¹ compared to 60 µmol m⁻² s⁻¹. Critically, a 163% improvement persisted through to final harvest — meaning early-propagation light intensity carries forward into commercial yield.

The lettuce data study demonstrates that light intensity during propagation — not only during the main growth phase — has lasting effects on final yield. This has direct implications for multi-tier vertical farm design: investment in high-output LED modules for propagation zones is not a luxury but a yield multiplier. Lumistrips' reel-to-reel manufactured flex LED strips allow uniform, high-PPFD coverage to be specified independently for propagation and production tiers — enabling targeted intensity management across the full growth cycle.
Propagation Light Intensity as a yield lever
One of the most overlooked aspects of light management is the propagation phase.
Research shows that light intensity during early growth stages influences final yield, morphology, and quality. Plants exposed to higher PPFD during propagation maintain a structural and physiological advantage throughout the growth cycle.
For vertical farms, this has direct engineering implications. Propagation zones should not be underlit — they are leverage points for yield optimization.
Carbon Metabolism: the mechanistic link
The morphological effects of light intensity are downstream of changes in carbon metabolism.
At optimal intensities, plants upregulate key Calvin cycle enzymes, including Rubisco and associated regulatory proteins. Sucrose and starch synthesis pathways accelerate, enabling efficient conversion of light into biomass.
Under low light, plants invest more carbon into structural adaptations (larger leaves, elongation), creating what researchers describe as a “carbon cost of light capture.” This reduces the fraction of energy available for harvestable biomass.

This explains why visually larger plants under low light can produce lower yields — a critical insight for growers relying on canopy appearance alone.
Light Intensity and Phytochemical Composition
Beyond yield and morphology, light intensity significantly affects crop quality at the biochemical level.
Carotenoids increase with higher PPFD, supporting both light harvesting and photoprotection. Anthocyanins and phenolic compounds also increase under higher light, driven by reactive oxygen species signaling and photoreceptor activation.

In leafy crops, this translates into improved nutritional value, stronger coloration, and higher antioxidant content.
However, responses are not always linear. In lettuce, increasing DLI improves biomass up to an optimal point (~11–12 mol·m⁻²·d⁻¹), after which further increases can reduce fresh weight and efficiency.
This reinforces a key principle: optimal intensity depends on the target outcome — not just maximum growth.
Uniformity: the hidden variable in Yield Consistency
While average PPFD is widely discussed, spatial uniformity is often underestimated.
In real systems, light distribution varies across the canopy. Lower layers may receive only 40–60% of the light available at the top due to shading.
This creates heterogeneous crop development:
* Elongated plants in low-light zones
* Compact plants in high-light zones
* Variable harvest timing and quality
Uniformity is therefore as important as absolute intensity.
Linear LED strip architectures offer a significant advantage here. Compared to point-source fixtures, they provide more even photon distribution, reducing hotspots and ensuring consistent plant development across the canopy.
However, when evaluating LED lighting systems for uniformity, it should be requested or measured:
Uniformity ratio (minimum PPFD / average PPFD) — target ≥ 0.85 for commercial production
PPFD at multiple canopy heights, not only at a fixed measurement plane
LED-to-LED flux variation specifications from the manufacturer (bin tolerance)
Optic beam angles appropriate for mounting height and row spacing
Practical Design Principles for intensity management
Effective lighting design translates plant physiology into engineering decisions.
The most important principles are:
Define the target outcome first. Maximum fresh weight, maximum dry weight, maximum phytonutrient content, and maximum secondary metabolite yield can require different PPFD strategies. For leafy greens sold by fresh weight, maximizing DLI within the linear response zone is generally optimal. For red-pigmented varieties, high intensity during propagation may provide a lasting quality premium.
Design for DLI, not PPFD alone. Two facilities delivering identical average PPFD over 12 vs. 18 hour photoperiods are providing 33% different total photon doses. The longer photoperiod also maintains plants in active photosynthesis for more hours, improving photosynthetic efficiency (higher DPI at equivalent DLI). LED's dimmability makes it practical to specify longer photoperiods at moderate PPFD rather than short bursts of high intensity.

Account for canopy development over time. As plants grow and canopy closes, self-shading increases. Lower canopy layers may receive a fraction of the overhead PPFD. Intra-canopy or inter-canopy LED strip positioning — possible with flexible PCB substrates — can address this by delivering light directly to mid- and lower-canopy zones, increasing whole-plant light use efficiency.
Respect species-specific saturation points. Driving PPFD above LSP wastes electrical energy, risks photodamage, and does not improve yield. Establishing crop-specific light response curves — ideally under your own production conditions — is more reliable than applying generic industry values.
Monitor and adjust seasonally. In greenhouse operations, natural DLI varies dramatically with season and latitude. A supplemental lighting strategy that achieves the target DLI in mid-winter (when natural contribution may be as low as 3–5 mol m⁻² d⁻¹) will over-supply light in summer without dimming capability. LED control systems that integrate real-time PPFD measurements and adjust output dynamically are no longer a premium feature — they are a requirement for energy-efficient year-round production.
Engineering Light for yield and structure
Light intensity is not a dial that linearly converts to yield. It is an environmental signal that triggers a cascade of morphological, physiological, and biochemical responses — some that growers want to amplify, some that they need to manage, and some that reveal themselves only at harvest in the form of nutritional composition rather than fresh weight.
The most important practical takeaway is that PPFD targets cannot be specified independently of species physiology, growth stage, photoperiod, and desired crop quality profile. Uniform delivery of well-characterized photon doses — possible with precision-manufactured LED strip systems — is the hardware foundation. But the hardware serves a biological logic that must be understood before the engineering can be optimized.
At Lumistrips, this is how we design horticulture lighting specification: starting from the crop's light response characteristics and working backward to the LED module design, PCB substrate selection, optic geometry, and control system requirements. Every component in the lighting chain exists to deliver a specific biological outcome — reliably, uniformly, and at the lowest possible energy cost per unit of yield.
Lumistrips - your partner for horticulture lighting solutions
Lumistrips is a German LED manufacturer with over 20 years of experience designing custom LED modules for demanding applications. Our horticulture lighting solutions draw on a verified supply chain — LEDs from Nichia, Cree, Seoul Semiconductor, Osram, and LumiLeds; optics from LEDiL, Carclo, Gaggione, and ARI — and are produced using advanced reel-to-reel flex manufacturing and FR4 rigid PCB processes. We partner with controlled environment agriculture operators, greenhouse engineers, and vertical farm developers to engineer lighting solutions from first principles.


Comments