Understanding DLI (Daily Light Integral) for horticulture
- Apr 29
- 12 min read
The metric that defines yield, quality, and energy efficiency in horticulture lighting. A practical guide for growers, engineers, and lighting designers.

From PPFD to DLI: the shift serious growers make
In controlled-environment agriculture, light is often discussed in terms of intensity, spectrum, or photoperiod. Yet plants do not respond to any of these variables in isolation. What ultimately governs growth is the total amount of usable light energy they receive over time. This is the role of Daily Light Integral, or DLI.
DLI represents the cumulative number of photosynthetically active photons delivered to a plant canopy over a full day. It reframes lighting from a static parameter into a dynamic input that plants integrate continuously. While PPFD measures how many photons arrive each second, DLI captures how much light the plant actually receives in total. This shift from instantaneous intensity to accumulated energy is what allows growers to align lighting strategies with plant biology.

What DLI actually measures
Daily Light Integral quantifies all photons within the photosynthetically active radiation range, between 400 and 700 nanometers, that reach a plant over a 24-hour period. It is expressed in mol·m⁻²·day⁻¹, a unit that directly reflects plant-relevant light exposure.
This makes DLI fundamentally different from traditional lighting metrics. Units such as lux or lumens are based on human vision and do not correlate well with plant growth, whereas DLI and PPFD are specifically designed to reflect how plants perceive and use light. For growers, this means that managing DLI is effectively managing the energy input that drives photosynthesis.
The relationship between Intensity and Time
The calculation of DLI is straightforward, yet it unlocks a powerful degree of flexibility in lighting design.
In short, DLI = PPFD \times photoperiod \times 0.0036
This equation shows that the same total light dose can be delivered through different combinations of intensity and photoperiod. For example, a moderate PPFD applied over a longer day can result in the same DLI as a higher intensity applied over a shorter duration. While mathematically equivalent, these strategies are not always biologically identical, and understanding the difference is key to optimizing crop performance.
The detailed calculation is:
DLI (mol m⁻² d⁻¹) = PPFD (µmol m⁻² s⁻¹) × photoperiod (hours) × 3,600 ÷ 1,000,000
You can also use the calculator below for refference DLI values for several crops:
For example, at a PPFD of 200 µmol m⁻² s⁻¹ over a 16-hour photoperiod, you are delivering a DLI of approximately 11.5 mol m⁻² d⁻¹. Run the same fixture for 18 hours and you reach 13.0. Dial intensity up to 250 µmol m⁻² s⁻¹ with the same 16-hour day and you hit 14.4, as the below table shows:
Quick reference — DLI at 200 µmol m⁻² s⁻¹ by photoperiod:
Photoperiod (h) | DLI (mol m⁻² d⁻¹) |
12 | 8.6 |
14 | 10.1 |
16 | 11.5 |
18 | 13.0 |
20 | 14.4 |
24 | 17.3 |
The arithmetic is simple; the strategic implications are not.
Why DLI is the True Driver of Yield in horticulture
Photosynthesis is an accumulative process. Plants convert light into chemical energy over time, meaning that total photon exposure is more important than momentary intensity. This is why DLI correlates strongly with biomass production, leaf area development, and crop uniformity.
Research consistently shows that when DLI drops below certain thresholds, plant growth becomes limited. For many species, values below approximately 10 mol·m⁻²·day⁻¹ result in slower development and reduced yield . At the same time, increasing DLI does not lead to unlimited gains. Beyond crop-specific saturation points, additional light produces diminishing returns and reduces overall system efficiency.
Crop-Specific DLI Requirements
Different crops have evolved under different light environments, and their DLI requirements reflect these origins. Leafy greens such as lettuce typically perform best at moderate DLI levels, where growth is efficient without excessive energy input. Fruiting crops such as tomatoes and cucumbers require significantly higher DLI because fruit production demands more energy.

The table below consolidates recommended values from published research and horticulture extension literature. These are meant as starting references, not fixed prescriptions — the correct DLI also depends on plant age, growth stage, CO₂ regime, temperature, and your production goals.
Vegetables and Herbs
Crop | Recommended DLI (mol m⁻² d⁻¹) | Notes |
Seedlings / cuttings | 5–10 | Propagation stage; higher DLI accelerates rooting and reduces elongation |
Micro-greens | 9–12 | Short cycle; uniformity matters more than peak intensity |
Lettuce | 12–17 | At DLI 15.6 and lower PPFD with longer photoperiod, greater fresh and dry mass than higher PPFD with shorter photoperiod |
Spinach | 14–20 | |
Parsley | 10–15 | |
Cilantro | 15–20 | |
Basil | 15–25 | |
Tomato | 20–30 | Optimal around 25 mol m⁻² d⁻¹; 1% less PAR ≈ 1% less production |
Cucumber | 20–30 | |
Pepper (Capsicum) | 20–30 | Supplemental lighting PPFD range: 120–300 µmol m⁻² s⁻¹ |
Zucchini | 20–30 | |
Eggplant | 20–30 | |
Strawberry | 15–50 | Wide range depending on growth phase; fruiting requires higher end |
Ornamentals and Cut Flowers
Crop | Recommended DLI (mol m⁻² d⁻¹) |
Impatiens | 8–12 |
Begonia | 12–19 |
Geranium (Pelargonium) | 12–19 |
Chrysanthemum (potted) | 6–10 |
Lilium (asiatic / oriental) | 8–12 |
Petunia | 20–25 |
Lavender (Lavendula) | 12–16 |
Marigold (Tagetes) | 12–16 |
Rose (cut flower) | 20–30 |
Dianthus (carnation) | 20–30 |
Notice the structural pattern: crops grown primarily for leaf biomass or flowers operate in the 10–20 mol m⁻² d⁻¹ range, while fruiting crops that must support reproductive metabolism require double or more. This is not arbitrary — fruiting demands substantially more fixed carbon than vegetative growth, and DLI is ultimately a proxy for the daily carbon budget available to the plant.
Optimal DLI Is Not Always Higher
A critical refinement in modern horticulture lighting is the understanding that more light is not always better. Studies on controlled environments have demonstrated that increasing DLI beyond optimal levels can reduce growth efficiency and even negatively affect plant quality.
For example, controlled experiments with lettuce show that growth improves as DLI increases up to around 11.5 mol·m⁻²·day⁻¹, but declines when DLI is pushed higher . This illustrates that each crop has an optimal DLI window where photosynthesis, morphology, and resource use efficiency are balanced.
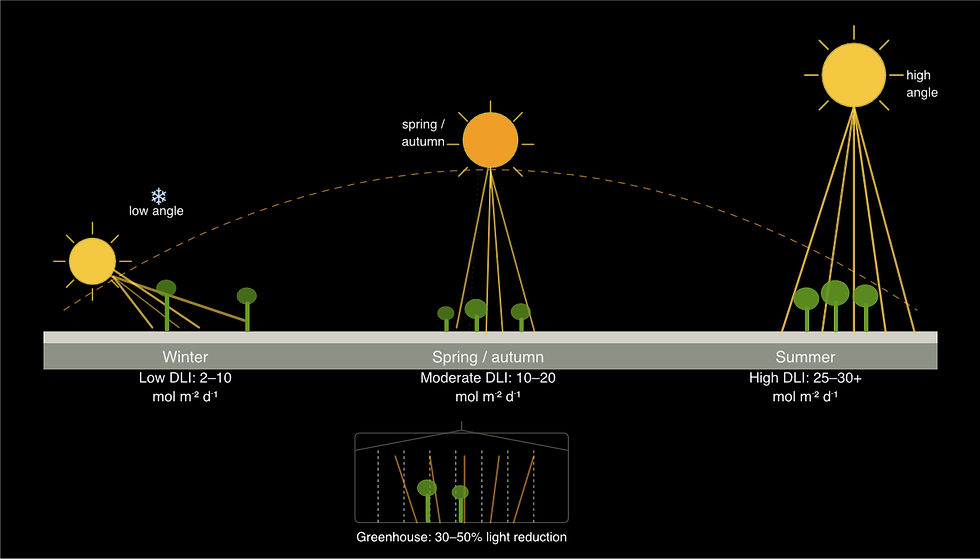
Regional DLI variations and seasonal effects
Natural DLI varies dramatically depending on location and time of year. In northern regions during winter, DLI can fall to extremely low levels, making supplemental lighting essential. Even in well-designed greenhouses, maximum DLI values are typically limited by structural and atmospheric losses.
In contrast, regions with higher solar radiation can provide much of the required DLI naturally, reducing reliance on artificial lighting. Research on greenhouse systems across different latitudes shows that lighting strategies must be adapted to local conditions, with lower energy requirements in regions where natural DLI is already sufficient.
Understanding your natural DLI baseline is essential before specifying any supplemental lighting system. The gap between what the sun provides and what your crop needs determines everything about your LED investment — power density, photoperiod requirements, and operating hours. This gap depends on the geographic location and below we provide some guidelines:
Europe
Outdoor annual average DLI varies enormously across Europe, driven by latitude, cloud cover, and seasonal patterns:
Country | Avg. Annual DLI (mol m⁻² d⁻¹) | Country | Avg. Annual DLI (mol m⁻² d⁻¹) |
United Kingdom | 10–20 | France | 26–30 |
Ireland | 16–20 | Switzerland | 26–30 |
Estonia | 10–15 | Romania | 26–30 |
Latvia | 16–20 | Hungary | 26–30 |
Lithuania | 16–20 | Austria | 21–35 |
Denmark | 16–20 | Italy | 31–35 |
Germany | 16–20 | Croatia | 31–35 |
Belgium | 21–25 | Bulgaria | 31–35 |
The Netherlands | 21–25 | Portugal | 31–35 |
Poland | 21–25 | Montenegro | 31–35 |
Czech Republic | 21–25 | Spain | 31–40 |
Belarus | 21–25 | Turkey | 31–40 |
Ukraine | 21–30 | Greece | 36–40 |
These are annual averages. Winter conditions — the critical period for supplemental lighting decisions — look very different.
In northern Europe outdoor DLI drops to approximately 5.3 mol m⁻² d⁻¹ in fall–winter, compared to 36.8 mol m⁻² d⁻¹ in summer. In a greenhouse with 70% PAR transmissivity, that fall–winter DLI at canopy level falls to roughly 3.7 mol m⁻² d⁻¹.
In many central European growing regions — monthly DLI ranges from 4–13 mol m⁻² d⁻¹ in winter to 29–46 mol m⁻² d⁻¹ in summer, a swing of more than 30 mol m⁻² d⁻¹ across the year. This 9-unit winter range (minimum to maximum across the country) narrows considerably compared to the 17-unit range in summer — meaning winter DLI is both low and spatially uniform, limiting the ability to rely on microclimate advantages.
For a tomato crop requiring 25 mol m⁻² d⁻¹, production without supplemental lighting would run approximately 85% below optimal — which is why year-round tomato growing without supplemental lighting is not economically viable at northern latitudes.
Mediterranean growers face the inverse of this problem: winter outdoor DLI in southern Europe drops to 8–9 mol m⁻² d⁻¹ from mid-September to January. With 60% greenhouse transmissivity, that delivers around 5–6 mol m⁻² d⁻¹ at the canopy — still about 76% below the tomato optimum, but meaningfully more manageable with supplemental lighting than ine northen Europe. The same LED system covering the DLI deficit in the Mediterranean needs to run fewer hours than in northern Europe, reducing both electricity consumption and fixture wear.
The practical implication for European growers: if your target DLI for any fruiting crop exceeds 20 mol m⁻² d⁻¹, you cannot meet it from natural light alone at any northern or central European location between October and March. Supplemental LED lighting is not optional — it is structurally required by the physics of your latitude.
United States
Outdoor DLI in the contiguous USA shows similarly dramatic geographic and seasonal variation, ranging from 5 to 60 mol m⁻² d⁻¹ depending on location and month. The Pacific Northwest and Northeast states see winter DLI values in the 10–20 mol m⁻² d⁻¹ range, broadly comparable to northern Europe. Southern and southwestern states — particularly Arizona, New Mexico, and southern California — sustain DLI values of 40–55+ mol m⁻² d⁻¹ in summer, far exceeding the requirements of even the most light-hungry crops.
Virginia, a mid-Atlantic reference point, illustrates the seasonal swing well: outdoor DLI ranges from 40–45 mol m⁻² d⁻¹ in July to 15–20 mol m⁻² d⁻¹ in December. That December figure sounds adequate for lettuce (target 12–17), but once greenhouse glazing takes 30–50% off the top, the canopy may receive as little as 8–12 mol m⁻² d⁻¹ — at or below the lower bound for productive lettuce culture.
This glazing loss deserves emphasis. Greenhouse structures routinely reduce incoming DLI by 30–50% through the combined effect of covering materials, structural members, and obstructions such as hanging baskets. In practice, values can fall 40–70% below outdoor levels in some configurations. A greenhouse receiving an outdoor DLI of 20 mol m⁻² d⁻¹ may be delivering only 10–14 to its crops. This is why outdoor DLI maps — while essential for regional planning — are never a substitute for canopy-level measurement.
DLI in real systems: Sunlight and LEDs
In practical horticulture systems, DLI is rarely delivered by a single source. Instead, it is the sum of natural sunlight and artificial lighting. This makes DLI a central parameter in greenhouse operation, where the objective is to maintain a consistent daily light dose regardless of weather conditions.
Modern systems achieve this through real-time measurement and dynamic control. By adjusting artificial lighting based on incoming sunlight, growers can maintain a stable DLI, ensuring consistent plant performance while minimizing energy waste.
Let's consider a concrete example for a northern European lettuce operation in December:
Outdoor DLI (northern Germany, December): ~8 mol m⁻² d⁻¹
Greenhouse transmission loss: 40% (60% reaches the canopy)
Natural DLI at canopy: 8 × 0.60 = 4.8 mol m⁻² d⁻¹
Target DLI for lettuce: 14 mol m⁻² d⁻¹
Supplemental lighting deficit: 14 − 4.8 = 9.2 mol m⁻² d⁻¹
To deliver 9.2 mol m⁻² d⁻¹ supplementally at 200 µmol m⁻² s⁻¹ we require:
(9.2 × 1,000,000) ÷ (200 × 3,600) = 12.8 hours per day of supplemental lighting
This is not a fixed schedule — the supplemental system should operate in the morning and evening hours when ambient PPFD is insufficient, and step back when midday sunlight can carry the load. Automated control systems tied to real-time PAR sensing can manage this dynamically, reducing electricity consumption versus a fixed photoperiod while maintaining the target DLI regardless of weather variability.
For a Mediterranean tomato operation targeting 25 mol m⁻² d⁻¹ in December (outdoor DLI ~10, greenhouse at 60% transmission → 6 mol m⁻² d⁻¹ at canopy), the deficit is 19 mol m⁻² d⁻¹. Published research confirms that an LED supplemental system at 200 µmol m⁻² s⁻¹ with an 18-hour photoperiod delivers a total DLI of approximately 19 mol m⁻² d⁻¹ in this scenario — still 24% below optimal, but substantially better than the 76% deficit without supplemental lighting. Alternatively, the same target can be reached with a shorter photoperiod (around 15 hours), reducing energy consumption while preserving LED module lifespan.
The interaction between DLI and Photoperiod
Although DLI defines total light quantity, photoperiod introduces an additional biological layer. Many plants respond to day length as a signal for developmental transitions such as flowering. This means that two lighting strategies delivering the same DLI can produce different outcomes if the photoperiod differs.
Furthermore, delivering DLI through very high light intensity over short periods can induce stress responses, reducing photosynthetic efficiency. This highlights the importance of balancing intensity and duration, rather than focusing on DLI as a standalone number.
For exampe, in cannabis, leaf rolling and bleaching can occur at PPFD above 1,500 µmol m⁻² s⁻¹ without CO₂ enrichment. In indoor production of herbs under blue-dominated spectra at high intensity, elevated leaf transpiration can reduce fresh weight and quality metrics, counteracting the DLI benefit.
The practical implication: very high PPFD delivered over a short photoperiod to meet a target DLI is not always equivalent to moderate PPFD over a longer photoperiod.
DLI and Spectrum: Quantity meets Efficiency
DLI measures the quantity of light, but spectrum determines how efficiently that light is used. Red light is highly effective at driving photosynthesis, while blue light influences plant structure and physiology. Far-red light plays a role in canopy development and light distribution, and full-spectrum white light supports overall plant health and visual assessment.
Because of this, two lighting systems delivering the same DLI can produce very different results depending on spectral composition. Effective horticulture lighting design therefore combines precise DLI control with optimized spectral output.
Engineering DLI in Modern Lighting Systems
In modern horticulture, lighting is no longer about delivering maximum output. It is about delivering the right amount of light with precision. Designing around DLI allows growers to match light delivery to plant demand, improving both yield and energy efficiency.
At Lumistrips, this approach is central to the development of custom LED modules and horticulture solutions. By combining high-efficacy LEDs with optimized optics and system-level design, it becomes possible to deliver uniform and accurate DLI across the canopy. This enables growers and OEMs to move from generic lighting setups to fully engineered solutions aligned with crop biology.
Applying DLI in practice: a decision framework
When designing, specifying or auditing a LED grow lighting system through the lens of DLI, the following sequence is useful:
1. Identifying your natural DLI baseline by month. Using geographic DLI maps for your region followed by applying the greenhouse transmission factor for your specific structure (typically 50–70% transmission, meaning 30–50% losses). Measurment should be made at canopy level during representative days — outdoor maps give regional context, but your building's specific geometry, glazing, and orientation will determine the real number.
2. Establish the target DLI for each crop and growth stage. Using the species-specific ranges in the table above as starting points DLI values are calculated for the entire production cycle — seedling, vegetative, and fruiting stages.
3. Calculate the supplemental DLI deficit by month. The gap between the target and your canopy-level natural DLI is what the LED system must cover. This deficit is largest in winter and at northern latitudes, and may disappear entirely in summer at southern European locations.
4. Determine the PPFD and operating hours required to close the deficit. Use the specific formula and methods, verification is made if the calculated PPFD is within the photosynthetic saturation range for your crop under your CO₂ regime.
5. Specify fixtures that deliver that PPFD uniformly across the canopy. Uniform DLI delivery requires uniform PPFD distribution — fixture photometry and mounting geometry both matter.
6. Implement active measurement and dynamic control. A fixed photoperiod cannot optimally manage DLI when natural light is variable. Real-time PAR sensing and dimming control is necessary for consistent DLI delivery and minimum electricity consumption.
7. Reviewing spectral composition within your DLI target. Photon quantity and photon quality are both inputs to plant response. The spectrum determines how efficiently each mole of photons in your daily budget is used.
Daily Light Integral is the foundation of modern horticulture lighting because it aligns directly with how plants grow. It transforms lighting design from a focus on intensity to a focus on total energy delivery, from fixed settings to adaptive strategies, and from generic illumination to crop-specific optimization.
Understanding and controlling DLI allows growers to predict plant performance, optimize energy use, and improve overall production efficiency. In a field where precision and consistency are critical, DLI is not just a useful metric—it is the central framework for designing high-performance horticulture lighting systems.
Frequently asked questions
What is DLI in LED grow lights?
DLI, or Daily Light Integral, measures the total amount of photosynthetically active light a plant receives over a day. It combines light intensity and duration into a single value that directly impacts plant growth and yield.
What is a good DLI for plants?
A good DLI depends on the crop. Leafy greens typically require 12–17 mol·m⁻²·day⁻¹, while fruiting crops like tomatoes need 20–30 mol·m⁻²·day⁻¹ or more for optimal growth.
How do you calculate DLI?
DLI is calculated by multiplying PPFD (µmol·m⁻²·s⁻¹) by photoperiod (hours) and a conversion factor. This converts light intensity over time into total daily photon delivery.
Is higher DLI always better?
No. Increasing DLI beyond optimal levels can reduce efficiency and even harm plants. Each crop has a specific DLI range where growth and energy use are balanced.
What is the difference between PPFD and DLI?
PPFD measures light intensity at a specific moment, while DLI measures the total amount of light received over a full day. DLI is a better indicator of plant growth performance.


Comments